| Home | The Vision | Springbrook — A Natural Wonder | The Springbrook Rescue Project | Support the Project | About ARCS |
|
The Science | ||||||||
| ||||||||
|
Science Projects
| ||||||||
|
Plant Growth Monitoring (SP1) and Community Assembly (SS2) Projects The cost of the project to date has been $150,000 in labour and materials excluding analysis. Assessments are directed at detecting healthy function or dysfunction in community assembly processes, successional dynamics, and plant productivity across the wide range of environmental gradients found on recovery areas. The primary aims of this monitoring program are: (a) to provide a solid empirical basis for deciding if, what and when active interventions might be required to assist natural regeneration; (b) to test the usefulness of our adopted ecological conceptual models and decision framework; (c) to assist development of an effective plant community assembly and growth model The first plots were established as a pilot program in April 2008 (24/04/2008), at the very beginning of the restoration project. To date, fifteen plots have been established across three properties (Warblers, Ashmiha and Pallida in the Mundora, Ee-jung and Boy-ull Creek catchments respectively) to monitor recruitment, growth, mortality and reproductive phenology of native plants and the effects of species interactions such as competition, facilitation, herbivory and disease on ecosystem dynamics. Each formal plot is 16.7 m x 16.7 m (a grid cell totalling 278 m2) and nested within a larger continuous grid-based monitoring system of 150 m x 150 m (See Photomonitoring Project.). Each plot is further subdivided into 81 equal subplots.
|
||||||||
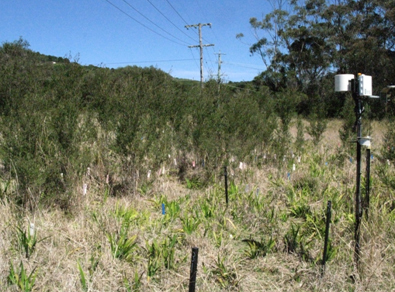
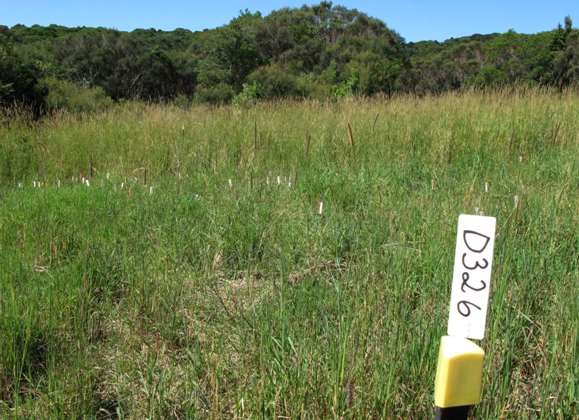
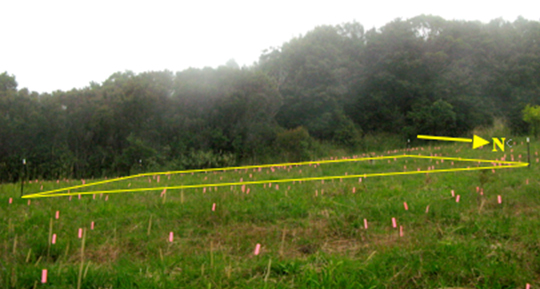 This image indicates a 16.67 m x 16.7 m grid cell in the D Block at Warblers. The location of each regenerating native plant in the cell is marked with a pink marker. Permanent steel star pickets mark plot corners. Photo: Keith Scott |
||||||||
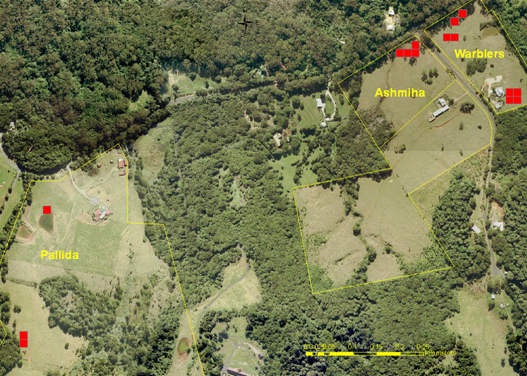 Growth monitoring plots are shown in red. Image prepared by Keith Scott using ArcGIS |
||||||||
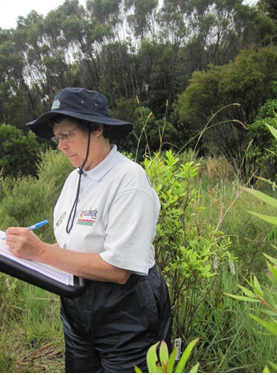
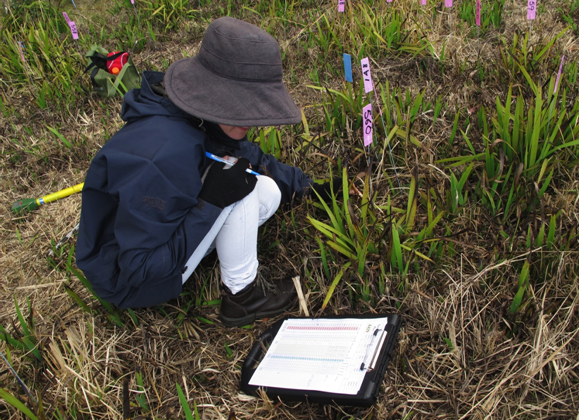
Manual recording has been found to be more suitable than digital devices such as a Trimble® Nomad® rugged hand-held computer, which we trialled, due to the complexity of data entry required of volunteers on which we depend. Photopoint recording of changes at each plot is carried out annually or associated with management interventions according to procedures outlined in Project SP3. Analysis of data is assisted by results from associated projects that measure the effects of the local and regional species pool (Projects SSP 1-3), and the abiotic conditions pertaining at each site (Projects SRC1, SRC2, SRC3). Management interventions are recorded and their effects analysed, and fed back into the Decision Framework to assist adaptive management. To date, a range of both wind- and animal-dispersed species is occurring among the regeneration. Five of these are rare or endangered. More than 50 species from 42 genera and 25 families have been recorded from the growth plots to date.
|
||||||||
|
||||||||
|
||||||||
|
||||||||
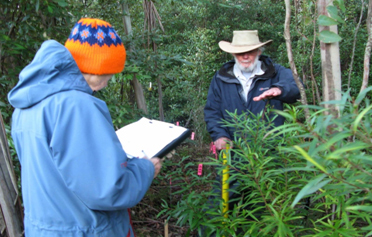
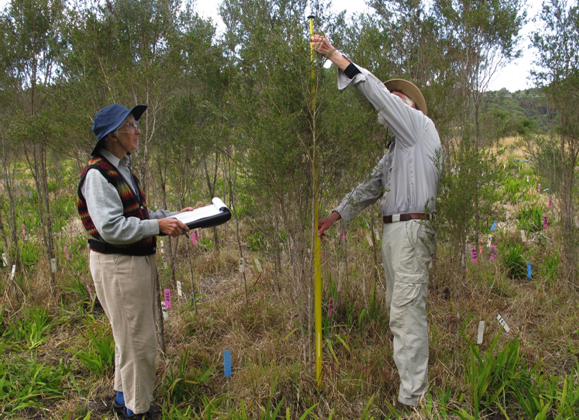
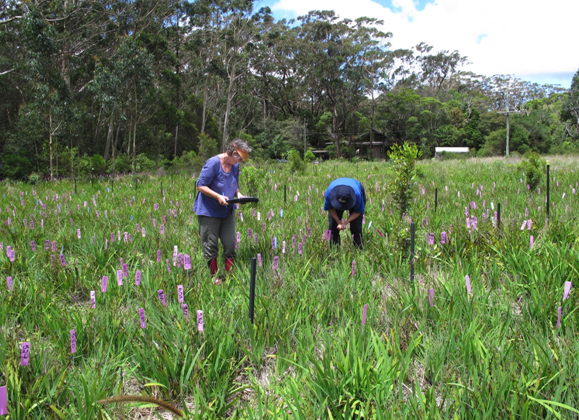 Regine and Jan marking and measuring new plants in Plot A429 |
||||||||
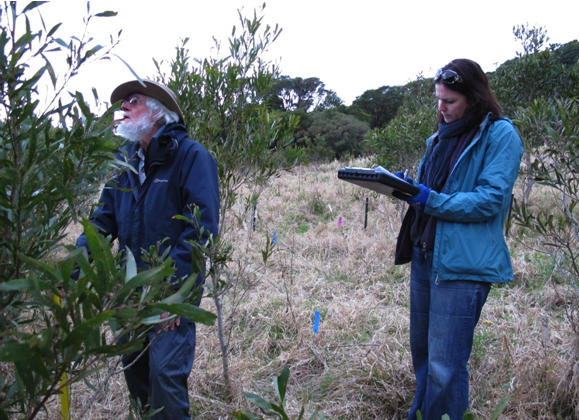
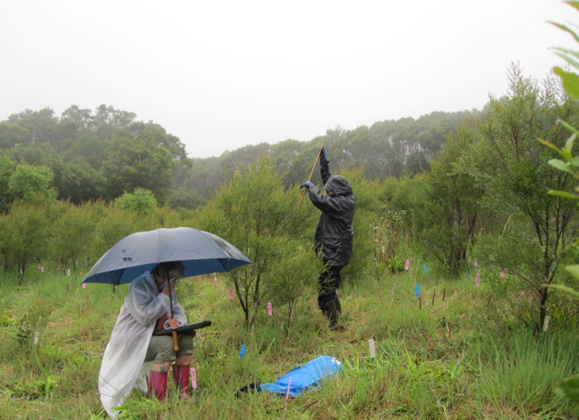 Regine and Aila measuring growth in Plot D326 under very wet conditions that often require waterproof paper and waterproof pens. Photo Rhea Phelan, December 2012 |
||||||||
 The same plot (D326) photographed from the reference star picket at the NW corner of the plot, on 17/4/2009 before the establishment of the 81 sub-plots within the cell |
||||||||
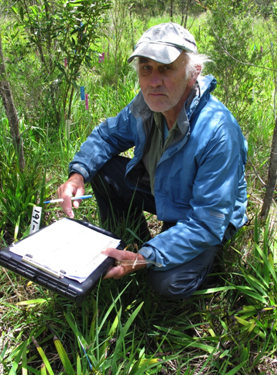
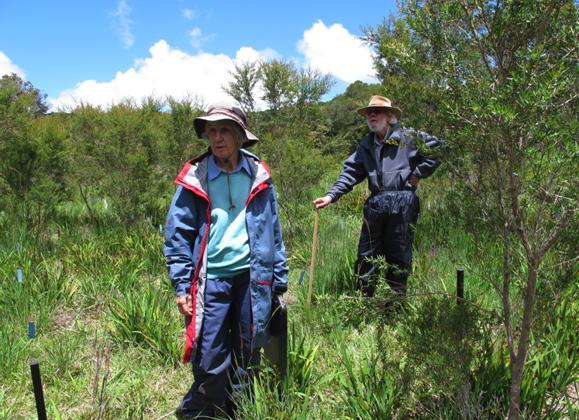 Keith and Fran take a break to admire last season’s growth in Plot A343 |
||||||||
 Ingrid and Keith recording growth on Plot G376, Pallida. Photo: Aila Keto |
||||||||
 Fran and Keith measuring growth follow the cold, dry winter season. Photo: Aila Keto |
||||||||
 Rhea measuring and recording growth of tiny seedlings barely 2 cm high. |
||||||||
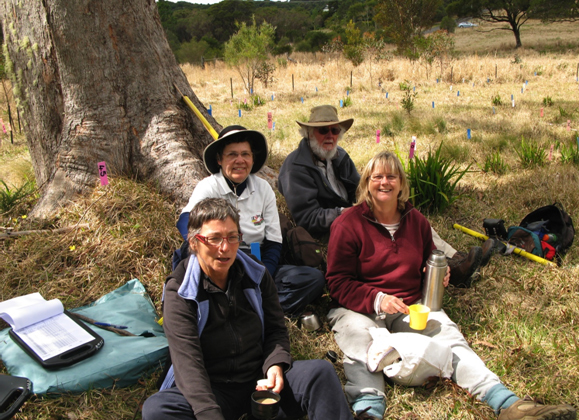 Leslie, Jan, Keith and Ceris (from left to right) stop for a well-earned coffee break after several hours of measurements on Ashmiha plots. Photo: Aila Keto |
||||||||
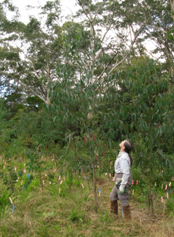
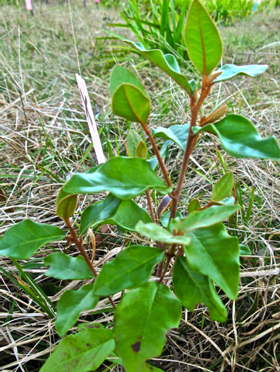
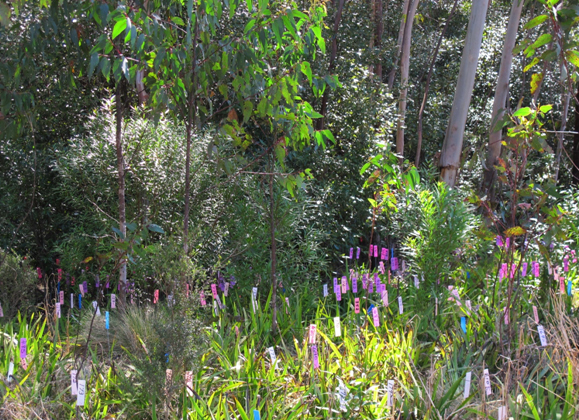 Regeneration on Growth Plot A518. Photo Aila Keto |
||||||||
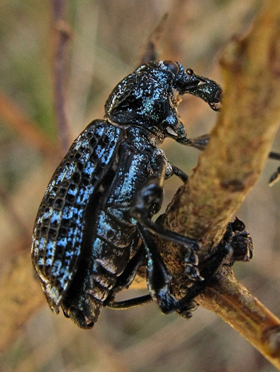
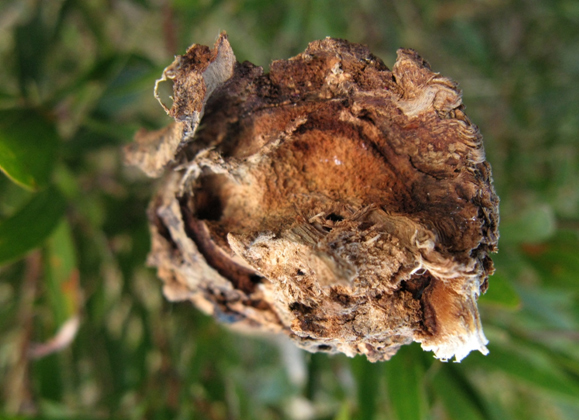 The fatal results of stem herbivory (ringbarking by the Botany Bay Weevil, larvae) on acacia regeneration on Plot G376, Pallida. Photo: Aila Keto |
||||||||
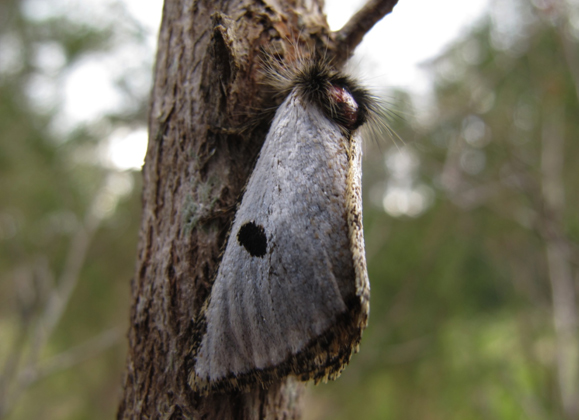 Most likely Epicoma melanospila (Family Notodontidae, Subfamily Thaumetopoeinae) found by Keith Scott on Leptospermum polygalifolium var. montanum at Growth Plot A343, Warblers. The very hairy larvae live in silk shelters or under the bark. They pupate in the ground litter or in the soil (Zborowski and Edwards (2007). Photo Aila Keto |
||||||||
|
||||||||
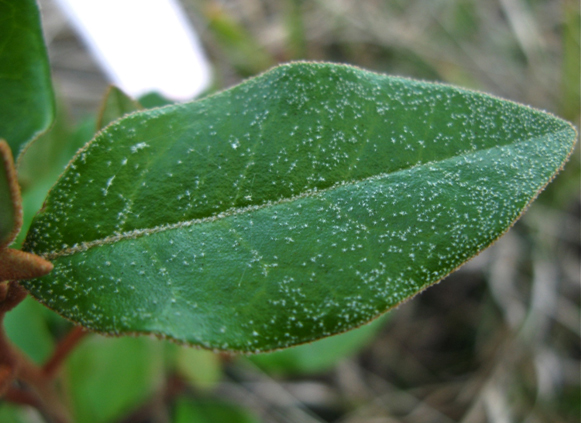 Closeup of Correa lawrenciana var. glandulifera leaf. Photo: Aila Keto |
||||||||
References Zborowski, P. and Edwards, T. (2007). A Guide to Australian Moths. CSIRO. P.175. |