1a. Recruitment
- Plant species assembly (density, richness) is monitored directly in the field by marking & labelling all new plants in each 16.66m x 16.66m sub-cell that is part of a continuous grid, annually for most (Project SS2), but seasonally in 15 subcells (Project SP1). Values are corrected for mortality at each measure. Species identifications are by ARCS experts or by verification of voucher specimens against a reference collection. Data are collated and initially analysed using FileMaker databases, Excel spreadsheets or relevant analytical statistical packages.
- A proxy for advanced recruitment involves aerial photography and GIS-based quantitative, grid-based assessment of the increase in vegetation extent.
Plant density at fine scales, where applicable, is estimated from the number of individuals per marked grid cell. |
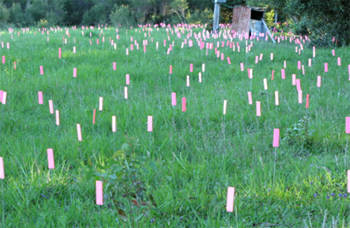
Labelling of regeneration |
1b. Plant community composition/structure
Trends in plant community composition and relative abundance are annually evaluated and based on seasonal monitoring of stratified quadrats compared with the previous years’ results and with characteristic composition and abundance of indicator species in corresponding Reference Sites (Project SSP4)
Changes in plant community structure is monitored in 15 stratified quadrats by comparing changes in overall height, canopy dimensions, and leaf area index, summarised by height-classes differing by 20 cm up to 1 m, and by 50 cm increments thereafter to ≥6 m (Project SP1). Heights are measured either with standard 1-m rulers, Senshin Fibreglass Telescopic Height Poles (1 to 6 metres), or Haglöf ECII Clinometer (≥6 m); stem diameters with diameter tapes (larger trees) or calipers (≤20 cm)
Data can be extrapolated to adjoining areas in order to predict their expected rates of change.
In older communities basal area estimates by random or systematic point sampling using a wedge prism or factor gauge.
Plant species assembly (richness) is monitored directly in the field by marking/labelling new plants annually in 16.66m x 16.66m sub-cells that are part of a continuous grid (Project SS2). Values are corrected for mortality at each recording.
Data are collated and analysed using FileMaker databases.
|
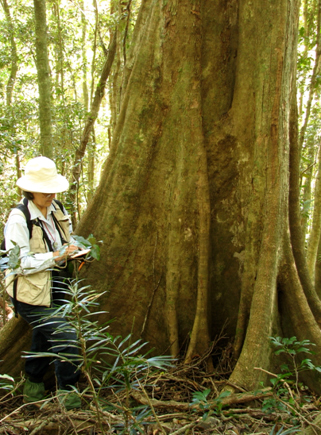
Plant surveys in reference sites
|
Plant surveys (either transect-based or random wandering) are conducted for completeness of biodiversity inventories over larger scales. These include voucher specimen-based sampling. Specimens are identified fresh and/or after pressing and drying. Specimens are archived for reference in the ARCS professional-standard herbarium.
Monitoring of World Heritage values and integrity is based on compliance with criteria in the WH Convention’s Operational Guidelines and involves phylogenetic and biogeographic updates for taxa of outstanding universal value. |

Part of the ARCS reference Herbarium
|
1c. Animal and fungal community composition/structure
- Targeted surveys and incidental observations (often associated with routine management activities) of mammals birds, frogs, reptiles, and selected invertebrates (including snails, ants, dung beetles, earthworms). Survey of dung beetles involves live collection and release from pitfall traps.
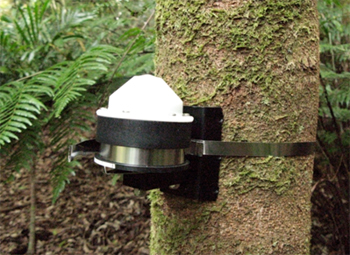
- Autonomous acoustic monitoring (Project SS1) using an omnidirectional, high-powered microphone (Song Meter SM2, Wildlife Acoustics Inc.). Identification to species and abundance assessment is by analysis of sonograms using specialist software (Songscope, Wildlife Acoustics Inc.). Reference sonograms of notes and songs for bird species total 748 individual records.
- Direct surveys of frogs utilize a range of omni- and uni-directional microphones and recording devices, e.g. H2n Zoom Recorder (Zoom Corporation), Sound Devices 722 Field Recorder with Senheiser MKH70 and ME67 shotgun microphones at sampling rates of 44.1 kHz and accuracy of 16 bit per sample.
- Camera trapping involves secured, motion-triggered Reconyx HyperFire HC600 3.1 megapixel colour/IR cameras at key locations. SDHC memory cards are downloaded monthly.
- Fungi surveys involve transects, incidental forays, and plot-based replicated sampling from wood, litter or soils using counts of fruit-bodies by species, drying and storing specimen, preparation of spore prints, and macroscopic examination, description and identification using stereo and/or compound microscopes.
Ad hoc incidental sightings are useful due to the frequent presence of regenerators on the site including volunteers from Birds Queensland; Project SS2 and Project SBD6
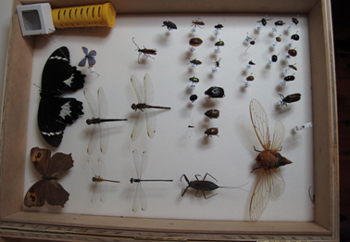
The beginnings of an insect reference collection |
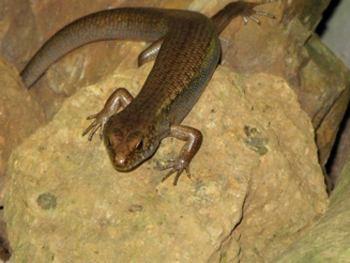
Reptiles: Eulamprus murrayi C1
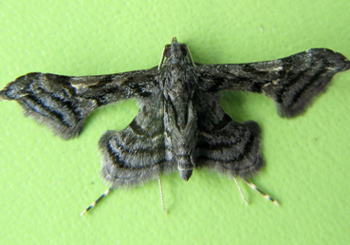
Insects: Unidentified moth
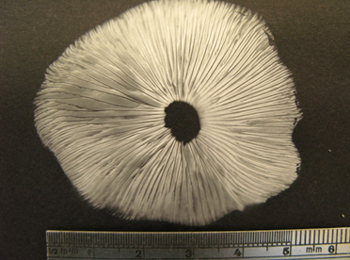
Fungal spore prints (Project SBD2)
|
2. Habitat of rare, threatened or significant species
Autonomous acoustic monitoring of bird and frog species (Project SS1) allows detection of rare, threatened or significant species and their abundances. Standard observations (incidental records) provide valuable supplementary records.
Plant species monitoring associated with routine marking and monitoring in Growth Plots (Project SP1) and in other Grid cells on the site (Project SS2).
Life-history attributes of indicator taxa are documented, with information on distribution (including at Springbrook), habitat, Ecology (general behaviour, feeding, reproduction), calls, taxonomic notes and phylogenetic significance, conservation status and threats, and management recommendations. Sixty-six of 118 fact sheets have been completed for birds and 29 for frogs. These will be posted on this web site when completed.
Indicator reptile species include Bellatorias major (Land Mullet) and Pseudechis porphyriacus (Red-bellied Black Snake).
Monitoring of World Heritage values and integrity is based on compliance with criteria in the WH Convention’s Operational Guidelines and involves phylogenetic and biogeographic updates on taxa contributing to outstanding universal value. |
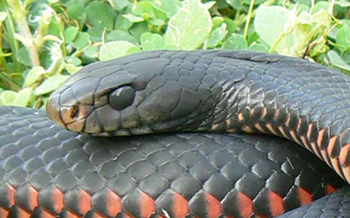 Red-bellied Black Snake – a trophic indicator species
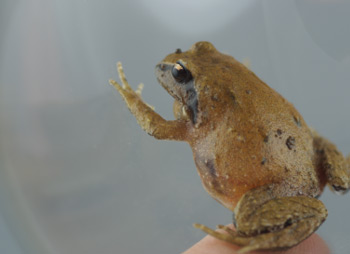 Masked Mountain Frog — a rare indicator species
|
3. Freedom from non-indigenous species
Quantitative assessment of plant/plant part removals (by weight and number/subcell) provides confirmation of trends on repeated removals (Project SD7).
Semi-quantitative assessment of effectiveness of repeated removal effort via inspection (scale of 1–4) and photopoint monitoring of each subcell on the site (Project SP4).
Quantitative and semi-quantitative methods (subjective rating scale and photographic records) for assessing effectiveness and efficiency of removals as above (Project SD7).
Setaria controlled by mowing where interference with natural regeneration is not compromised, and hand-shearing otherwise. |
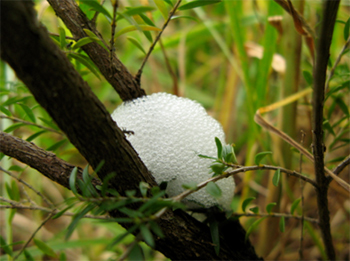
Spittle bug infestations cause high mortality of leptospermum
regeneration, a vital pioneer species on low-fertility soils. |
4. Functional diversity recovery
The biodiversity surveys (Projects SBD1-7) provide the basic information for assessing functional groups integrity. Functional groups are defined by taxonomic, phylogenetic, morphological, and trophic classes; with subsets relating to niche specialization (resource, habitat, reproduction); as well as to fragmentation sensitivity (area- and barrier-sensitive; habitat specialist; dispersal-limited; metapopulation-dependent, otherwise ecologically important or phylogenetically significant) (Project SBD9).
Allied measures of taxonomic distinctness and phylogenetic diversity provide complementary indicators of diversity more allied to functional diversity and the influence of disturbance.
Surveys of birds and frogs at some sites are restricted to incidental records and acoustic monitoring using omnidirectional, high-powered microphones (Song Meter, Wildlife Acoustics Inc.). Identification to species is by analysis of sonograms using specialist software (Songscope, Wildlife Acoustics Inc.) (Project SS1) |
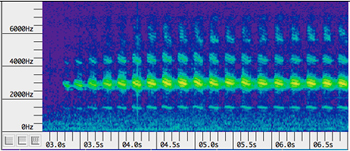 A typical sonogram assisting identification of frog and bird
species captured by automomous acoustic monitoring. |
5a. Abiotic conditions — Microclimate
(a) Seven ARCS micrometeorological nodes (Project SRC1) sample parameters at 15 min intervals: rainfall, PAR, air RH & T, leaf wetness, soil moisture and soil water potential; Additional nodes only sample PAR at 3 heights as a function of distance from forest edge to assess the impact of shading or diameter increments using dendrometers.
(b) The wireless sensor network (Project SRC2) 175 CSIRO nodes.
Monitoring elsewhere as required is by using a Kestrel 4500 Pocket Weather Meter with comparisons to adjacent cleared areas with formal weather stations.
Micrometeorological monitoring is extrapolated to nearby analogous environments where nodes are not located. |
Dendrometers automatically measure tree diameter changes in response to microclimate changes monitored in Project SRC1 and SRC2.
|
5b. Abiotic conditions — Soil and litter health recovery
Soil health assessments are conducted as part of Project SRC3. Soil compaction and moisture levels are considered a minimal set of surrogate indicators of soil health at a broad scale (other physical parameters measured on more limited stratified quadrats include depth, texture, pH (Kelway Soil pH Meter), dispersion and colour). Soil colour is based on Munsell Colour charts.
Transect-based measure of soil compaction is done using a drop-cone penetrometer (model based on xxx and fabricated for ARCS by xxx); soil moisture other than at micrometeorological stations is measured using a portable MPKit (ICT International)
Earthworm activity (a key bioindicator including of soil organic matter) is semi-quantitative (counts per unit area dug) but non-lethal, non-invasive soil imaging methods are being investigated
Leaf litter levels measured by steel prong capture method
Macrofungi surveys in stratified quadrats (Project SBD2) are indicative of soil health and successional development
The method chosen depends on the nature of the substrate. |
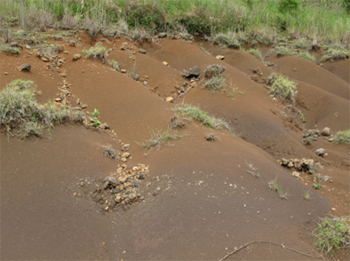
Erosion spreading upslope on compacted slopes in high rainfall zones. Photo: Aila Keto
|
6. Ecosystem functions normal for stage of development
System processes (functions) of relevant to monitoring of restoration are at the level of individuals ((physiological), populations (demographic), ecosystems (biogeochemical cycling, soil-water fluxes, biotic interactions) and the landscape (hydrological, fire regimes, geomorphic processes and species movements). Key processes relating to species interactions including competition, mutualism, facilitation, predation and herbivory are considered in project activities. |
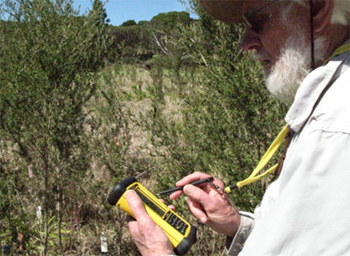
Recording field data. |
7. Canopy Cover (surrogate for functional connectivity)
Aerial photography (NearMap) and GIS-based quantitative, grid-based assessment of canopy cover to determine extent of connectivity recovery in key bottleneck areas. NearMap images are available at varying intervals (18/1/2011, 19/6/2011, 21/7/2011, 9/11/2011,14/6/2012, 5/8/2012).
Estimates of Leaf Area Index (LAI) and effective plant biomass outside the WSN nodes using a portable ceptometer (AccuPAR, LP-80, Decagon Devices, Inc.) provide a measure of average canopy density based on degree of light transmission.
Alternatively, finer-scale assessments are carried out using point sampling with a Spherical Crown Densitometer or line-point transect sampling with a GRS Densitometer. The latter method allows greater characterisation of forest structure in addition to canopy closure levels |
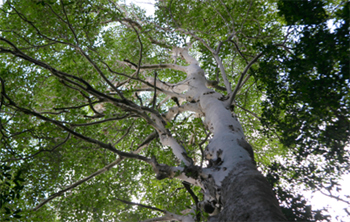
The challenge of monitoring canopy cover as a surrogate
for landscape connectivity. Photo: Mark Ash |
8. Threat mitigation progress
Threats are categorized into groups relating to which aspect of the ecological conceptual model is affected:
- Species pool effects: insufficient ecological resources to restore and maintain viable populations; introduced plants, fungi, animals
- Resources-climate effects: altered biogeochemical processes
- Disturbance regime effects: fire, frost, climate change, disease etc
- Species interaction imbalances or losses (trophic or non-trophic)
Threats associated with social systems strongly focus on:
- Governance deficiencies
- Social learning impediments to paradigm shifts
|
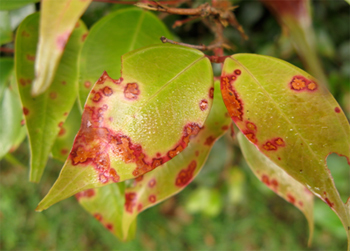 Myrtle Rust fungus, a disease likely to cause widespread extinction within the Myrtaceae, a major component of Australian ecosystems. Photo: Aila Keto
 |
9. Ecosystem stability (resistance/resilience)
Our broad- and fine-scale ecological conceptual models provide the basis for assessing emergent system dynamics that consider the necessary elements contributing to resistance/resilience — the drivers of environmental change (species pool characteristics, climate, resource fluxes, disturbance regimes), and state response variables (ecosystem structure and processes, including system feedbacks that might stabilise/destabilise alternative stable states) (Project SS3).
A resilience model directs monitoring experiments for assessing drivers and response variables affecting ecosystem dynamics and potential for sudden, essentially irreversible change in ecosystem states (Project SS3). Monitoring variance in the degree of shading in quadrats using a portable ceptometer (AccuPAR LP-80, Decagon Devices, Inc.) is deemed a strong proxy for detecting potential switches in states.
Macrofungi surveys in stratified quadrats (Project SBD2) are expected to provide long-term indicators of soil health and successional development. |
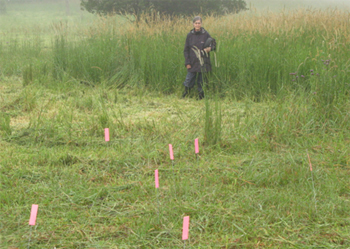
Shoulder high, necrotosing setaria grass forms stable alternative states blocking natural regeneration |
10. Self-sustaining ability
Ecological measures of sustainability include: attainment of reproductive maturity and reproductively viable population size of members of key functional groups. These are long-term metrics and do not apply until 10-20 years into the project.
Economic measure: when the costs of ongoing management do not exceed those of mature undisturbed ecosystems. All activities associated with the project are timed and costed to be able to assess management effectiveness, efficiency and, in part, project completion (Projects R1, R2). |
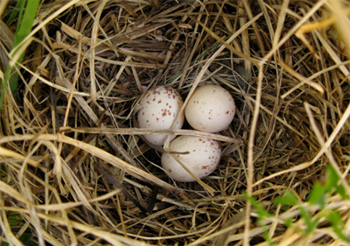 Increasing indications of reproductive success in regeneration sites at Warblers in the Mist (Mundora catchment)
 |
|
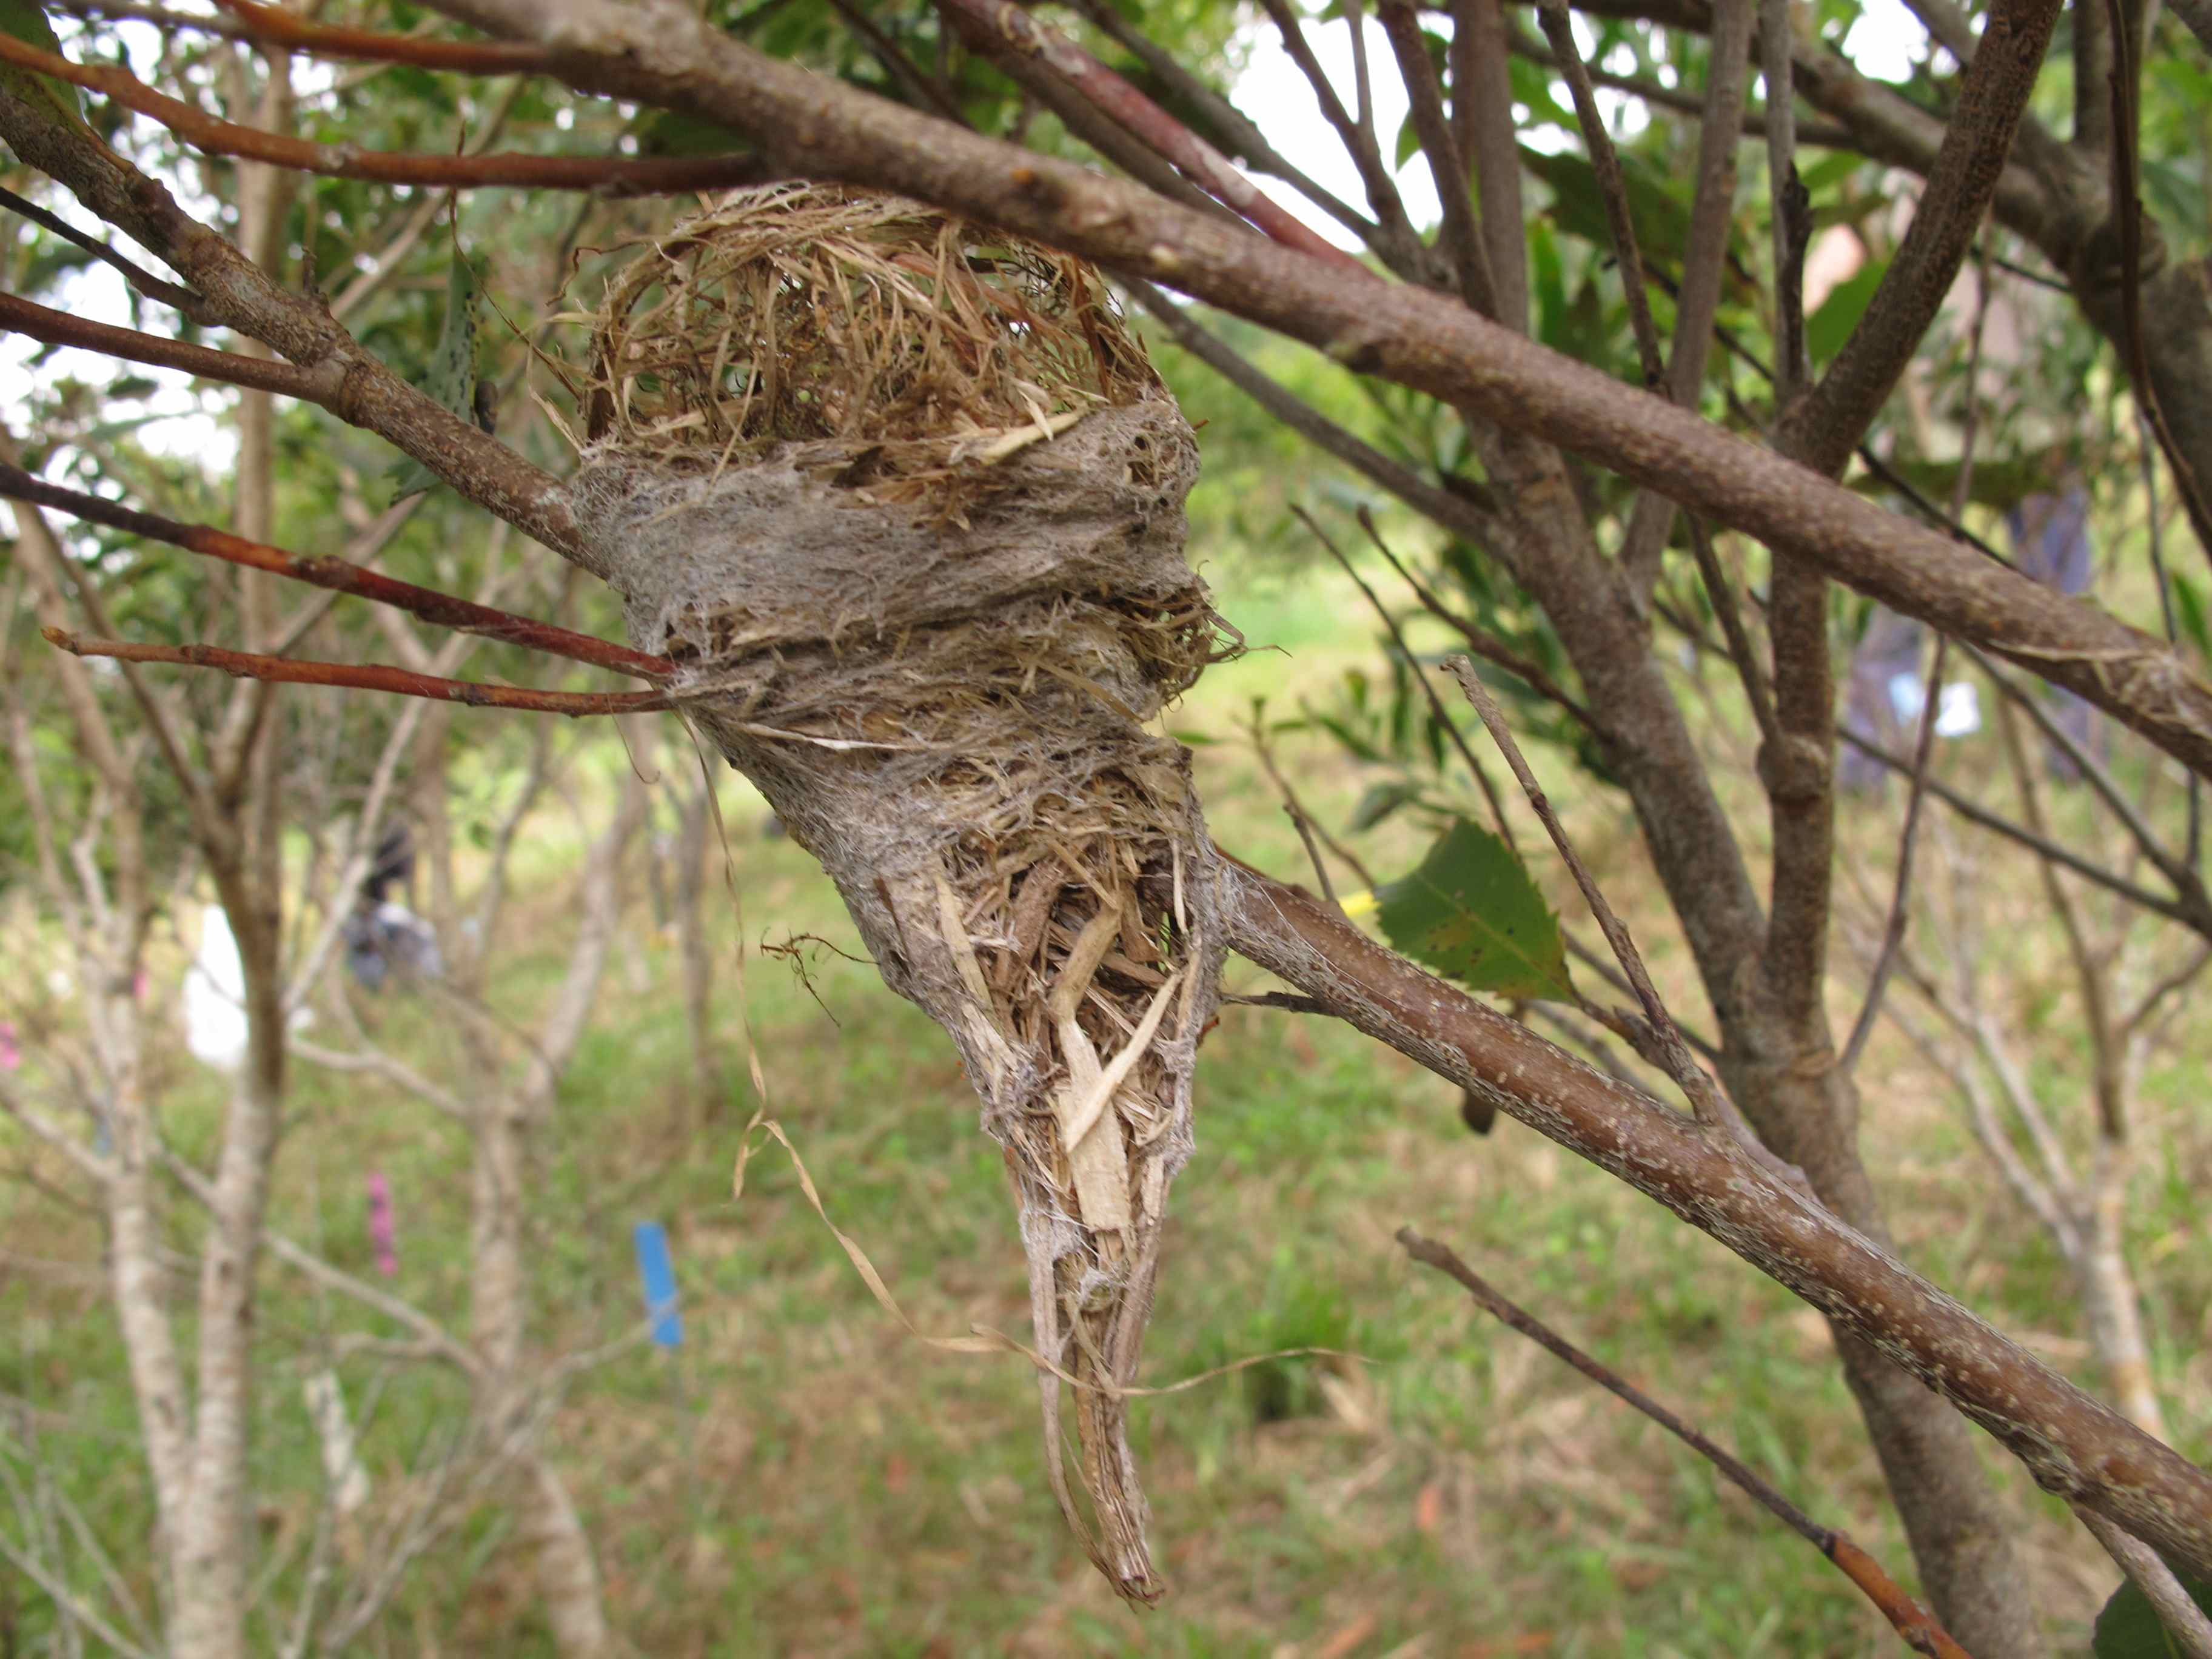 A Rufous Fantail nest in the making in Growth Plot G376
at Pallida (Boy-ull catchment) |